by
Samuel H. Williamson
MeasuringWorth
sam@mswth.org
How fast did the United Kingdom real GDP grow between 1958 and 1959? By consulting the official numbers of the 51 UK annual government reports since those two years, you can choose 18 different values in a range between 2.66% to 4.68%. Which is correct? Or perhaps the question is which of these 18 choices is 'relevant?' If you are interested in how people were reacting to the reports at the time, then the relevant number is 2.66%, the growth computed for the 1960 report. If you are interested in the most consistent time series, then perhaps it is the 4.68% from the 2012 report. But in 2011 it was 4.28%, which does not give one much confidence that the 2013 report will not be different again.
This paper investigates changes in the official published values of the United Kingdom's annual nominal and real Gross Domestic Product (GDP) from 1952 to the present. In general, we might expect estimates of nominal GDP to change for a few years after the initial estimate, as new data become available, and to then stay fixed. This does not occur with the United Kingdom (UK) data; instead, as this paper will show, estimates of nominal GDP going back to the very beginning of the historical data are regularly revised, and these revisions are significant in magnitude1. We also might expect estimates of historical real GDP to change only when the base year changes, so that estimates of real growth would be constant otherwise. This does not occur either; instead, there have been significant revisions, and in six cases they changed direction. That is, if the estimate was an expansion for a particular year, yet another publication showed negative growth. This paper presents and analyzes changes in reported estimates of nominal GDP and real growth rates.
Annual GDP estimates from the reports published yearly from 1959 to 2012 have been gathered for this study and are available from the author. Data were primarily collected from the Economic Trends Annual Supplement (ETAS) publication, which provided long run historical data. This publication was only produced in the years 1975-2006; for years that the publication was not available, the yearly 'Blue Book' publication (titled National Income and Expenditure in its early years, and then United Kingdom National Accounts) is used. Where no single estimate of GDP is produced, and either an income-based or expenditure-based measure must be chosen, the expenditure-based measure was used. Note that no GDP estimates are included from the year 1978; this is not due to a gap in the data, but rather to a delay between publications of the Economic Trends Annual Supplement.
How are the Calculations Made?
One can be sure that the formulas, equations and programs used to compute GDP these days are numerous. With the report of the latest annual computations the Office for National Statistics (ONS) also published a table of 3,563 variables they may have used or constructed. In December, I downloaded this table titled BB_CSDB_DS. The data are annual from 1938 to 2011, and start with A4FK (ESA:PC:LIFLOW: Currency and deposits) and end with ZYBQ (Financial derivatives -CG-Asset). It is important to note that these are not all input variables2. There may be a newer version of this table, but I cannot find it by simple search of the ONS website. As you see in the table, for the early years there are no observations for most of the variables. For 1948, the first year for which the ONS publishes annual GDP, there are 231 nonzero observations and many of them are aggregates such as, Total Gross Final Expenditure (unaligned) and Total Actual Individual Consumption. Even for 1975, less than 25% of the variables have a value.
Number of observations in table BB_CSDB_DS
| YEAR | Positive | Negative | Zero | Blank |
|---|---|---|---|---|
| 1938 | 10 | 0 | 14 | 3539 |
| 1948 | 190 | 9 | 42 | 3322 |
| 1958 | 226 | 6 | 57 | 3274 |
| 1959 | 230 | 5 | 56 | 3272 |
| 2010 | 2903 | 347 | 313 | 0 |
| 2011 | 2452 | 273 | 238 | 600 |
The nominal aggregates can change because of a change in the way components are added up. The components can change because there has been historical research creating new data. Without being able to see this table for earlier years, I cannot know for sure if there were more or less variables or if the nominal values have changed3. For example, the nominal value for GDP in 1958 is different in every report from 1959 to 1974, starting at $22,493 million and ending at $22,843 million. After that it 'only changes' ever two three years. For the 2006 to 2012 reports is stayed at $23,050 million4. To repeat, without seeing the tables use for construction in the earlier years, it is not possible to know why there were so many changes.
It is also unlikely that there have been 18 different sets of new data to use in the last 50 years that would explain how the growth rate between 1958 and 1959 changed so often.
Nominal GDP
Table 1A in the Appendix shows changes in estimates of nominal GDP over time. By looking at the years of maximum and minimum observations, between the 1960s and the last few years there have been upward revisions of up to ten percent. 49 of the 67 years that nominal GDP was estimated have their maximum estimate in 2006 or later. The magnitude of these changes is sizable: the mean difference between the maximum and minimum estimates expressed as a percentage of the minimum (shown in the last column of the Table) is 4.39%.
When revisions to historical data do occur, they frequently occur for most years at once. In only one year, 1998, there is a systematic decrease in historical GDP estimates, while the other instances of widespread revisions all involve systematic increases where almost all years show an increase in the estimate of nominal GDP. The 1998 exception may be attributable to the United Kingdom's conversion to the European Union national account system in that year. These systematic changes frequently affect nearly all values; indeed, in 2006, the historical estimates increased for all but one year. Changes to historical estimates in between these major revisions tend to be small or non-existent; for instance, in the years 1969-1974, there are no changes to previously made estimates.
Real GDP
Table 2A in the Appendix show changes in estimated yearly real growth rates over time. As with the nominal GDP data, we note widespread and significant revisions to historical data, although the upward trend in these revisions is not as steady. Looking at the years of maximum and minimum observations, we see that in 54 of the 63 years that growth was estimated, either the maximum or the minimum estimate occurred at least five years after the initial estimate, indicating a widespread trend of revisions. In 58 of the years, the difference between the maximum and minimum estimates is at least 0.5%; the mean difference is 1.15%. In 31 of the years, the maximum occurs in the 2012 estimate, indicating that there were significant upward revisions in the most recent ONS data. All these revisions result in the real GDP for 1948 being reduced by 14% between the 2011 and 2012 ONS reports. 5
Quarterly Data
As the quarterly data (when available) have been revised at the same time as the annual data, the same issues of variation will be true. We have not evaluated all the quarterly data, but have looked at four periods where there was a reported business cycle.
In 1972, real GDP grew somewhere between 2% and 3.86% depending on which year of official data you are looking at. This preceded the worldwide recession of 1974 with major crashes in stock indexes including the FT30 that lost about three forth of its value.
The first and third quarters of the 1972 data estimate a slowdown in real GDP as seen in Chart 1 and Table 1. When these data were first reported in 1975, it was reported that there was a sharp drop of 1.38% in the first quarter and .76% in third. Over the years there were revisions. By the time of the report dated 2006, the forecasted drop of the first quarter was gone and the third quarter had an anemic, but very small increase of .22%.
Chart 1
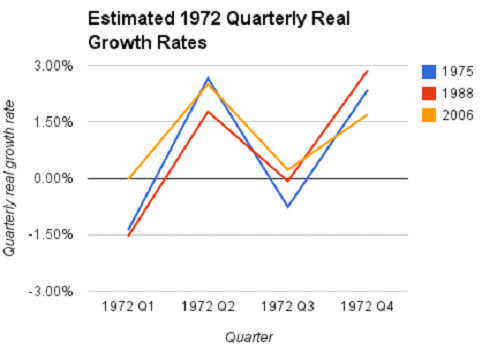
Table 1
| Year Data Reported | 1975 | 1988 | 2006 | |||
|---|---|---|---|---|---|---|
| Real GDP | Quarterly growth | Real GDP | Quarterly growth | Real GDP | Quarterly growth | |
| 1971 Q4 | 13239 | 49717 | 134282 | |||
| 1972 Q1 | 13056 | -1.38% | 48949 | -1.54% | 134241 | -0.03% |
| 1972 Q2 | 13403 | 2.66% | 49816 | 1.77% | 137602 | 2.50% |
| 1972 Q3 | 13301 | -0.76% | 49779 | -0.07% | 137909 | 0.22% |
| 1972 Q4 | 13614 | 2.35% | 51207 | 2.87% | 140250 | 1.70% |
Were the ups and downs of GDP in 1972 any indicator of what was going to happen? Did the reported changes have an impact on people's behavior up to these crashes? One can only speculate. When did the 1974-75 recession start and how bad was it? In 1976 the ETAS reported that real GDP grew .20% in 1974 and fell 1.29% the next year. By 1989, that same report said real GDP fell by 1.82% in 1974 and continued to fall in 1975 by another .80%. The quarterly data also tell different stories depending on the year of the report. All six of them shown in Table 2 and Chart 2 show a decline in the first quarter of 1974 and that decline 'becomes' much worse the more recent the report. By 1990, the drop was 2.52%, when it was only .84% in the 1975 report. All the reports show a rebound of the second quarter, but three of the reports show growth slowing in the third quarter and three show it increasing. All the reports agree on the negative growth of the fourth quarter.
Chart 2
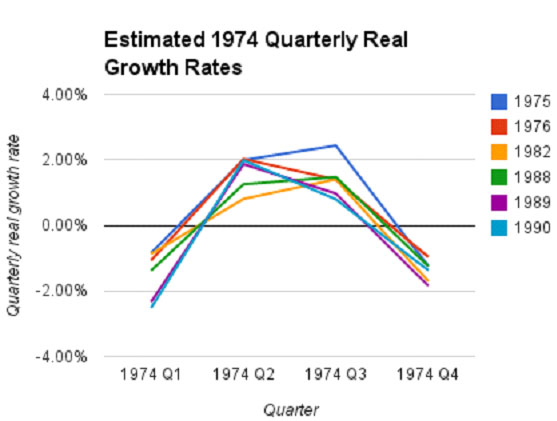
Table 2
| Year Data Reported | 1975 | 1976 | 1982 | |||
|---|---|---|---|---|---|---|
| Real GDP | Quarterly growth | Real GDP | Quarterly growth | Real GDP | Quarterly growth | |
| 1973 Q4 | 13960 | 14118 | 26371 | |||
| 1974 Q1 | 13843 | -0.84% | 13967 | -1.07% | 26142 | -0.87% |
| 1974 Q2 | 14118 | 1.99% | 14249 | 2.02% | 26352 | 0.80% |
| 1974 Q3 | 14461 | 2.43% | 14448 | 1.40% | 26721 | 1.40% |
| 1974 Q4 | 14281 | -1.24% | 14309 | -0.96% | 26266 | -1.70% |
| Year Data Reported | 1988 | 1989 | 1990 | |||
| Real GDP | Quarterly growth | Real GDP | Quarterly growth | Real GDP | Quarterly growth | |
| 1973 Q4 | 53268 | 74713 | 74971 | |||
| 1974 Q1 | 52533 | -1.38% | 72968 | -2.34% | 73084 | -2.52% |
| 1974 Q2 | 53190 | 1.25% | 74328 | 1.86% | 74531 | 1.98% |
| 1974 Q3 | 53972 | 1.47% | 75049 | 0.97% | 75123 | 0.79% |
| 1974 Q4 | 53300 | -1.25% | 73668 | -1.84% | 74093 | -1.37% |
1979 has one of the largest volatilities in estimates of its GDP among all the years covered, with a range of 1.92% between the maximum of 2.85% reported in 1991 ETAS and the minimum estimates of 0.93% in the report from ten years earlier. Looking at the quarterly data in Table 3 and Chart 3, we see that this change is attributable to a significant decrease (roughly 50%) in the estimated contraction occurring in the first quarter of 1979. This is of particular significance given that 1979 was also an election year in the United Kingdom, and Margaret Thatcher rose to power in the May election in large part due to concerns about the economy, albeit those were motivated in large part by concerns about excessive union power rather than simple economic growth.4
Chart 3
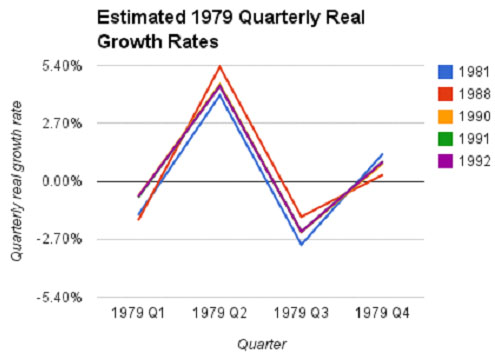
Table 3
| YEAR | 1981 | 1988 | 1990 | |||
|---|---|---|---|---|---|---|
| Real GDP | Quarterly growth | Real GDP | Quarterly growth | Real GDP | Quarterly growth | |
| 1978 Q4 | 28674 | 58102 | 81148 | |||
| 1979 Q1 | 28223 | -1.57% | 57042 | -1.82% | 80577 | -0.70% |
| 1979 Q2 | 29352 | 4.00% | 60083 | 5.33% | 84215 | 4.51% |
| 1979 Q3 | 28485 | -2.95% | 59089 | -1.65% | 82226 | -2.36% |
| 1979 Q4 | 28852 | 1.29% | 59270 | 0.31% | 82913 | 0.84% |
| YEAR | 1991 | 1992 | ||
|---|---|---|---|---|
| Real GDP | Quarterly growth | Real GDP | Quarterly growth | |
| 1978 Q4 | 81371 | 81320 | ||
| 1979 Q1 | 80758 | -0.75% | 80739 | -0.71% |
| 1979 Q2 | 84346 | 4.44% | 84320 | 4.44% |
| 1979 Q3 | 82367 | -2.35% | 82342 | -2.35% |
| 1979 Q4 | 83129 | 0.93% | 83098 | 0.92% |
For the annual reports after 1992 stated it was a year of negative growth with a fall in output of .53%. However, later reports stated otherwise, and by 2012 it was decided that output for that year had increased by .86%.
These revisions also had an impact on the quarterly data as can be seen in Table 4 and Chart 4. The initial estimate of 1992 quarterly growth shows a contraction of .82 in the first quarter, followed by anemic growth in the second, with some improvement in the second half of the year. The estimate in a couple of years later shows a similar pattern, the most notable difference being a downward revision in 1992's last quarter growth. Ten years later, however, the history has changed. Now the first quarter of 1992 has positive growth and the contraction in the second quarter rather than the first. The contraction is also not even half the size of that estimated in earlier years. As the January 4, 1992 issue of The Economist notes, the recession that had begun in Britain in 1990 was a significant issue of concern at the time, particularly as the British government faced elections in that year (p. 24). 2 Furthermore, an article in Glasgow's The Herald noted that worse-than-expected performance in the first quarter of 1992 contributed to predictions of prolonged slow growth and high unemployment.3 If the revised data had been available at the time, the timing of these concerns would have been different. We can only guess how much rosier the picture would appear from the perspective of 2012, where quarterly estimates are not available, but growth for 1992 is listed as 0.86% versus an initial estimate of a 0.47% contraction.
Chart 4
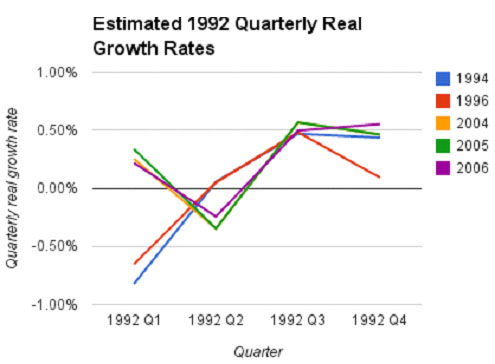
Table 4
| YEAR | 1994 | 1996 | 2004 | |||
|---|---|---|---|---|---|---|
| Real GDP | Quarterly growth | Real GDP | Quarterly growth | Real GDP | Quarterly growth | |
| 1991 Q4 | 134658 | 134838 | 188306 | |||
| 1992 Q1 | 133550 | -0.82% | 133957 | -0.65% | 188783 | 0.25% |
| 1992 Q2 | 133624 | 0.06% | 134025 | 0.05% | 188128 | -0.35% |
| 1992 Q3 | 134250 | 0.47% | 134671 | 0.48% | 189194 | 0.57% |
| 1992 Q4 | 134836 | 0.44% | 134795 | 0.09% | 190067 | 0.46% |
| YEAR | 2005 | 2006 | ||
|---|---|---|---|---|
| Real GDP | Quarterly growth | Real GDP | Quarterly growth | |
| 1991 Q4 | 193968 | 200579 | ||
| 1992 Q1 | 194622 | 0.34% | 201017 | 0.22% |
| 1992 Q2 | 193947 | -0.35% | 200527 | -0.24% |
| 1992 Q3 | 195046 | 0.57% | 201521 | 0.50% |
| 1992 Q4 | 195948 | 0.46% | 202634 | 0.55% |
Notes
1. Bill Martin, 'The Puzzle Behind Britain's Lamentable Statistics,' Financial Times, February 23, 2007.
2. 'In the Dumps,' The Economist, January 4, 1992, 24, http://find.galegroup.com.proxy.cc.uic.edu/econ/dispBasicSearch.do?prodId=ECON&userGroupName=uic (accessed March 13, 2013).
3. R. E. Dundas, 'Kern Warns on UK Economy: Growth to Remain Slow,' The Herald, June 5, 1992, http://www.lexisnexis.com.proxy.cc.uic.edu/hottopics/lnacademic/ (accessed March 13, 2013).
4. Norman Webster, 'They're Off: Looks Like It'll Be a Rough Campaign,' The Globe and Mail, March 30, 1979, http://find.galegroup.com.proxy.cc.uic.edu/econ/dispBasicSearch.do?prodId=ECON&userGroupName=uic (accessed March 15, 2013) and 'International News,' The Associated Press, May 5, 1979, http://find.galegroup.com.proxy.cc.uic.edu/econ/dispBasicSearch.do?prodId=ECON&userGroupName=uic (accessed March 15, 2013).
5. 'Rosy Prospects, Forgotten Dangers,' The Economist, April 15, 2000, 15, http://find.galegroup.com.proxy.cc.uic.edu/econ/dispBasicSearch.do?prodId=ECON&userGroupName=uic (accessed March 25, 2013).
Table 1A. Range of Variation in the Nominal Observations of UK GDP as Reported in Various Bluebooks and Other Official Publications. (millions of pounds)
| Year | Maximum Observation | Minimum Observation | Bluebook Year of Maximum Observation | Bluebook Year of Minimum Observation | MAX-MIN | MAX-MIN as % of MIN |
|---|---|---|---|---|---|---|
| 1938 | 5,568 | 5,568 | 1962 | 1962 | 0.00% | |
| 1946 | 10,060 | 9,869 | 1984 | 1952 | 191 | 1.94% |
| 1947 | 10,765 | 10,559 | 1984 | 1952 | 206 | 1.95% |
| 1948 | 11,988 | 11,643 | 2006 | 1952 | 345 | 2.96% |
| 1949 | 12,732 | 12,282 | 2006 | 1952 | 450 | 3.66% |
| 1950 | 13,308 | 12,687 | 2008 | 1952 | 621 | 4.89% |
| 1951 | 14,793 | 13,838 | 2006 | 1952 | 955 | 6.90% |
| 1952 | 16,023 | 15,576 | 2006 | 1963 | 447 | 2.87% |
| 1953 | 17,147 | 16,711 | 2006 | 1962 | 436 | 2.61% |
| 1954 | 18,148 | 17,659 | 2006 | 1963 | 489 | 2.77% |
| 1955 | 19,505 | 18,984 | 2006 | 1964 | 521 | 2.74% |
| 1956 | 20,966 | 20,526 | 2006 | 1959 | 440 | 2.14% |
| 1957 | 22,117 | 21,671 | 1985 | 1998 | 446 | 2.06% |
| 1958 | 23,065 | 22,492 | 1985 | 1959 | 573 | 2.55% |
| 1959 | 24,348 | 23,693 | 2008 | 1962 | 655 | 2.76% |
| 1960 | 25,977 | 25,081 | 2008 | 1962 | 896 | 3.57% |
| 1961 | 27,488 | 26,486 | 1986 | 1962 | 1,002 | 3.78% |
| 1962 | 28,845 | 27,859 | 1989 | 1963 | 986 | 3.54% |
| 1963 | 30,632 | 29,624 | 1986 | 1964 | 1,008 | 3.40% |
| 1964 | 33,436 | 32,442 | 1989 | 1965 | 994 | 3.06% |
| 1965 | 36,042 | 34,878 | 1989 | 1966 | 1,164 | 3.34% |
| 1966 | 38,387 | 37,165 | 1989 | 1967 | 1,222 | 3.29% |
| 1967 | 40,481 | 39,883 | 1988 | 1998 | 598 | 1.50% |
| 1968 | 43,950 | 43,228 | 1985 | 1998 | 722 | 1.67% |
| 1969 | 47,172 | 46,281 | 1989 | 1977 | 891 | 1.93% |
| 1970 | 51,770 | 50,785 | 1990 | 1975 | 985 | 1.94% |
| 1971 | 57,864 | 56,660 | 1988 | 1975 | 1,204 | 2.12% |
| 1972 | 64,663 | 62,787 | 1994 | 1975 | 1,876 | 2.99% |
| 1973 | 74,545 | 71,483 | 2008 | 1975 | 3,062 | 4.28% |
| 1974 | 84,513 | 81,032 | 2008 | 1975 | 3,481 | 4.30% |
| 1975 | 106,717 | 102,929 | 2008 | 1979 | 3,788 | 3.68% |
| 1976 | 126,798 | 122,277 | 1985 | 1977 | 4,521 | 3.70% |
| 1977 | 147,068 | 140,460 | 2012 | 1979 | 6,608 | 4.70% |
| 1978 | 169,453 | 161,639 | 2012 | 1980 | 7,814 | 4.83% |
| 1979 | 199,251 | 189,702 | 2012 | 1981 | 9,549 | 5.03% |
| 1980 | 233,184 | 225,560 | 2008 | 1982 | 7,624 | 3.38% |
| 1981 | 256,440 | 248,398 | 2012 | 1983 | 8,042 | 3.24% |
| 1982 | 281,250 | 274,183 | 2012 | 1984 | 7,067 | 2.58% |
| 1983 | 307,425 | 300,589 | 2012 | 1986 | 6,836 | 2.27% |
| 1984 | 330,026 | 319,354 | 2012 | 1986 | 10,672 | 3.34% |
| 1985 | 361,758 | 351,567 | 2008 | 1987 | 10,191 | 2.90% |
| 1986 | 389,149 | 374,895 | 2008 | 1988 | 14,254 | 3.80% |
| 1987 | 429,613 | 414,455 | 2012 | 1989 | 15,158 | 3.66% |
| 1988 | 480,406 | 463,933 | 2012 | 1990 | 16,473 | 3.55% |
| 1989 | 528,118 | 511,413 | 2012 | 1992 | 16,705 | 3.27% |
| 1990 | 574,074 | 550,350 | 2012 | 1993 | 23,724 | 4.31% |
| 1991 | 603,402 | 573,645 | 2012 | 1994 | 29,757 | 5.19% |
| 1992 | 627,766 | 596,165 | 2012 | 1994 | 31,601 | 5.30% |
| 1993 | 660,830 | 630,023 | 2012 | 1995 | 30,807 | 4.89% |
| 1994 | 700,569 | 668,255 | 2012 | 96-7 | 32,314 | 4.84% |
| 1995 | 741,846 | 700,890 | 2012 | 96-7 | 40,956 | 5.84% |
| 1996 | 788,386 | 742,300 | 2012 | 1997 | 46,086 | 6.21% |
| 1997 | 835,635 | 801,972 | 2012 | 1998 | 33,663 | 4.20% |
| 1998 | 882,718 | 843,725 | 2012 | 1999 | 38,993 | 4.62% |
| 1999 | 929,469 | 891,106 | 2012 | 2000 | 38,363 | 4.31% |
| 2000 | 976,533 | 943,412 | 2008 | 2001 | 33,121 | 3.51% |
| 2001 | 1,021,828 | 988,014 | 2008 | 2002 | 33,814 | 3.42% |
| 2002 | 1,075,564 | 1,043,945 | 2008 | 2003 | 31,619 | 3.03% |
| 2003 | 1,139,746 | 1,099,896 | 2008 | 2004 | 39,850 | 3.62% |
| 2004 | 1,202,956 | 1,164,439 | 2009 | 2005 | 38,517 | 3.31% |
| 2005 | 1,262,710 | 1,224,715 | 2012 | 2006 | 37,995 | 3.10% |
| 2006 | 1,333,157 | 1,299,622 | 2012 | 2007 | 33,535 | 2.58% |
| 2007 | 1,412,119 | 1,398,882 | 2012 | 2009 | 13,237 | 0.95% |
| 2008 | 1,446,113 | 1,433,870 | 2009 | 2011 | 12,243 | 0.85% |
| 2009 | 1,401,863 | 1,392,705 | 2012 | 2010 | 9,158 | 0.66% |
| 2010 | 1,466,569 | 1,458,452 | 2012 | 2011 | 8,117 | 0.56% |
| 2011 | 1,516,153 | 1,516,153 | 2012 | 2012 | - |
Table 2A. Range of Variation in the Annual Growth Rate of Real UK GDP as Reported in VariousBluebooks and Other Official Publications.
| Year | Maximum Observation | Minimum Observation | Bluebook Year of Maximum Observation | Bluebook Year of Minimum Observation | MAX-MIN |
|---|---|---|---|---|---|
| 1949 | 3.72% | 2.97% | 2012 | 1981 | 0.75% |
| 1950 | 3.66% | 2.85% | 1984 | 2006 | 0.81% |
| 1951 | 3.64% | 2.09% | 1975 | 1990 | 1.55% |
| 1952 | 1.08% | -0.24% | 1985 | 1975 | 1.32% |
| 1953 | 4.67% | 3.64% | 1964 | 2006 | 1.03% |
| 1954 | 4.57% | 3.73% | 1959 | 1965 | 0.84% |
| 1955 | 3.89% | 3.09% | 1989 | 1998 | 0.80% |
| 1956 | 2.08% | 0.90% | 1962 | 2006 | 1.18% |
| 1957 | 2.04% | 1.37% | 1975 | 1959 | 0.67% |
| 1958 | 0.69% | -0.50% | 2012 | 1959 | 1.19% |
| 1959 | 4.68% | 3.68% | 2012 | 1962 | 1.00% |
| 1960 | 5.83% | 4.44% | 1989 | 1962 | 1.39% |
| 1961 | 3.40% | 2.13% | 1967 | 1962 | 1.27% |
| 1962 | 1.46% | -0.13% | 2012 | 1963 | 1.59% |
| 1963 | 5.13% | 3.63% | 2004 | 1964 | 1.50% |
| 1964 | 5.91% | 5.06% | 1967 | 1980 | 0.85% |
| 1965 | 2.59% | 2.09% | 2012 | 1976 | 0.50% |
| 1966 | 2.26% | 1.59% | 2012 | 1967 | 0.67% |
| 1967 | 2.82% | 2.28% | 2012 | 1989 | 0.54% |
| 1968 | 4.57% | 3.42% | 2012 | 1975 | 1.15% |
| 1969 | 2.40% | 1.14% | 2012 | 1975 | 1.26% |
| 1970 | 2.56% | 2.17% | 2012 | 1975 | 0.39% |
| 1971 | 2.79% | 1.90% | 1977 | 1989 | 0.89% |
| 1972 | 3.86% | 1.99% | 2012 | 1979 | 1.87% |
| 1973 | 8.03% | 5.51% | 1980 | 1975 | 2.52% |
| 1974 | 0.69% | -1.82% | 1975 | 1989 | 2.51% |
| 1975 | -0.51% | -1.73% | 2012 | 1979 | 1.22% |
| 1976 | 4.20% | 2.57% | 1981 | 2012 | 1.63% |
| 1977 | 2.45% | 0.98% | 2005 | 1981 | 1.47% |
| 1978 | 3.83% | 3.13% | 1986 | 1980 | 0.70% |
| 1979 | 2.85% | 0.93% | 1991 | 1981 | 1.92% |
| 1980 | -1.35% | -2.59% | 1982 | 1984 | 1.24% |
| 1981 | -1.15% | -2.00% | 1985 | 1983 | 0.85% |
| 1982 | 2.36% | 0.99% | 1984 | 1987 | 1.37% |
| 1983 | 3.83% | 3.33% | 2012 | 1985 | 0.50% |
| 1984 | 2.94% | 1.77% | 2012 | 1986 | 1.17% |
| 1985 | 3.87% | 3.51% | 2012 | 1989 | 0.36% |
| 1986 | 4.30% | 2.90% | 2012 | 1988 | 1.40% |
| 1987 | 5.16% | 4.35% | 2012 | 1989 | 0.81% |
| 1988 | 5.57% | 4.16% | 2012 | 1990 | 1.41% |
| 1989 | 2.59% | 2.11% | 2012 | 1993 | 0.48% |
| 1990 | 1.82% | 0.40% | 2012 | 1994 | 1.42% |
| 1991 | -1.36% | -2.24% | 2004 | 1993 | 0.88% |
| 1992 | 0.86% | -0.53% | 2012 | 1996 | 1.39% |
| 1993 | 3.09% | 2.05% | 2012 | 1995 | 1.04% |
| 1994 | 4.66% | 3.85% | 2001 | 1996 | 0.81% |
| 1995 | 3.18% | 2.46% | 2012 | 96-7 | 0.72% |
| 1996 | 3.11% | 2.35% | 2012 | 1997 | 0.76% |
| 1997 | 3.86% | 3.04% | 2012 | 2006 | 0.82% |
| 1998 | 3.84% | 2.24% | 2011 | 1999 | 1.60% |
| 1999 | 3.66% | 2.11% | 2011 | 2000 | 1.55% |
| 2000 | 4.46% | 2.88% | 2011 | 2001 | 1.58% |
| 2001 | 3.15% | 1.93% | 2011 | 2002 | 1.22% |
| 2002 | 2.66% | 1.73% | 2011 | 2003 | 0.93% |
| 2003 | 3.81% | 2.25% | 2012 | 2004 | 1.56% |
| 2004 | 3.26% | 2.76% | 2006 | 2008 | 0.50% |
| 2005 | 2.77% | 1.84% | 2012 | 2007 | 0.93% |
| 2006 | 2.85% | 2.60% | 2009 | 2012 | 0.25% |
| 2007 | 3.63% | 2.56% | 2012 | 2009 | 1.07% |
| 2008 | 0.74% | -1.10% | 2009 | 2011 | 1.84% |
| 2009 | -3.97% | -4.90% | 2012 | 2010 | 0.93% |
| 2010 | 1.80% | 1.76% | 2012 | 2011 | 0.04% |
| 2011 | 0.76% | 0.76% | 2012 | 2012 | 0.00% |
Bibliography
England. Central Statistical Office. Her Majesty's Stationery Office. Economic Trends Annual Supplement No. 1, 1975. Vol. 1. London: n.p., 1975. Print.
England. Central Statistical Office. Her Majesty's Stationery Office. Economic Trends Annual Supplement No.2, 1976. Vol. 2. London: n.p., 1976. Print.
England. Central Statistical Office. Her Majesty's Stationery Office. Economic Trends Annual Supplement No. 3, 1977. Vol. 3. London: n.p., 1977. Print.
England. Central Statistical Office. Her Majesty's Stationery Office. Economic Trends Annual Supplement No. 4, 1979. Vol. 4. London: n.p., 1978. Print.
England. Central Statistical Office. Her Majesty's Stationery Office. Economic Trends Annual Supplement No. 5, 1980. Vol. 5. London: n.p., 1979. Print.
England. Central Statistical Office. Her Majesty's Stationery Office. Economic Trends Annual Supplement No. 6, 1981. Vol. 6. London: n.p., 1980. Print.
England. Central Statistical Office. Her Majesty's Stationery Office. Economic Trends Annual Supplement No. 7, 1982. Vol. 7. London: n.p., 1981. Print.
England. Central Statistical Office. Her Majesty's Stationery Office. Economic Trends Annual Supplement No. 8, 1983. Vol. 8. London: n.p., 1982. Print.
England. Central Statistical Office. Her Majesty's Stationery Office. Economic Trends Annual Supplement No. 9, 1984.Vol. 9. London: n.p., 1983. Print.
England. Central Statistical Office. Her Majesty's Stationery Office. Economic Trends Annual Supplement No. 10, 1985. Vol. 10. London: n.p., 1985. Print.
England. Central Statistical Office. Her Majesty's Stationery Office. Economic Trends Annual Supplement No. 11, 1986. Vol. 11. London: n.p., 1986. Print.
England. Central Statistical Office. Her Majesty's Stationery Office. Economic Trends Annual Supplement No. 12, 1987. Vol. 12. London: n.p., 1987. Print.
England. Central Statistical Office. Her Majesty's Stationery Office. Economic Trends Annual Supplement No. 13, 1988. Vol. 13. London: n.p., 1988. Print.
England. Central Statistical Office. Her Majesty's Stationery Office. Economic Trends Annual Supplement No. 14, 1989. Vol. 14. London: n.p., 1989. Print.
England. Central Statistical Office. Her Majesty's Stationery Office. Economic Trends Annual Supplement No. 15, 1990. Vol. 15. London: n.p., 1990. Print.
England. Central Statistical Office. Her Majesty's Stationery Office. Economic Trends Annual Supplement No. 16, 1991. Vol. 16. London: n.p., 1991. Print.
England. Central Statistical Office. Her Majesty's Stationery Office. Economic Trends Annual Supplement No. 17, 1992. Vol. 17. London: n.p., 1992. Print.
England. Central Statistical Office. Her Majesty's Stationery Office. Economic Trends Annual Supplement No. 18, 1993. Vol. 18. London: n.p., 1993. Print.
England. Central Statistical Office. Her Majesty's Stationery Office. Economic Trends Annual Supplement No. 19, 1994. Vol. 19. London: n.p., 1994. Print.
England. Central Statistical Office. Her Majesty's Stationery Office. Economic Trends Annual Supplement No. 20, 1995. Vol. 20. London: n.p., 1995. Print.
England. Central Statistical Office. Her Majesty's Stationery Office. Economic Trends Annual Supplement No. 21, 1996. Vol. 21. London: n.p., 1995. Print.
England. Central Statistical Office. Her Majesty's Stationery Office. National Income and Expenditure: 1946-1951. London: n.p., August 1952. Print.
England. Central Statistical Office. Her Majesty's Stationery Office. National Income and Expenditure: 1959. London: n.p., 1959.
England. Central Statistical Office. Her Majesty's Stationery Office.National Income and Expenditure: 1960. London: n.p., 1960.
England. Central Statistical Office. Her Majesty's Stationery Office.National Income and Expenditure: 1961. London: n.p., 1961.
England. Central Statistical Office. Her Majesty's Stationery Office.National Income and Expenditure: 1962. London: n.p., 1962.
England. Central Statistical Office. Her Majesty's Stationery Office.National Income and Expenditure: 1963. London: n.p., 1963.
England. Central Statistical Office. Her Majesty's Stationery Office.National Income and Expenditure: 1963-1973. London: n.p., 1974.
England. Central Statistical Office. Her Majesty's Stationery Office. National Income and Expenditure: 1964. London: n.p., 1964.
England. Central Statistical Office. Her Majesty's Stationery Office. National Income and Expenditure: 1965. London: n.p., 1965.
England. Central Statistical Office. Her Majesty's Stationery Office.National Income and Expenditure: 1966. London: n.p., 1966.
England. Central Statistical Office. Her Majesty's Stationery Office.National Income and Expenditure: 1967. London: n.p., 1967.
England. Central Statistical Office. Her Majesty's Stationery Office.National Income and Expenditure: 1968. London: n.p, 1968.
England. Central Statistical Office. Her Majesty's Stationery Office.National Income and Expenditure: 1969. London: n.p., 1969.
England. Central Statistical Office. Her Majesty's Stationery Office.National Income and Expenditure: 1970. London: n.p., 1970.
England. Central Statistical Office. Her Majesty's Stationery Office.National Income and Expenditure: 1971. London: n.p., 1971.
England. Central Statistical Office. Her Majesty's Stationery Office.National Income and Expenditure: 1972. London: n.p., 1972.
England. Central Statistical Office. Her Majesty's Stationery Office.National Income and Expenditure: 1973. London: n.p., 1973.
Dundas, R.E. "Kern Warns on UK Economy: Growth to Remain Slow." The Herald (Glasgow) [Glasgow] 5 June 1992: n. pag. Print.
In the Dumps." The Economist [London] 4 Jan. 1992: 24. Print. http://find.galegroup.com.proxy.cc.uic.edu/econ/dispBasicSearch.do?prodId=ECON&userGroupName=uic (accessed March 13, 2013).
"International News." The Associated Press [New York City] 5 May 1979: n. pag. Print. http://find.galegroup.com.proxy.cc.uic.edu/econ/dispBasicSearch.do? prodId=ECON&userGroupName=uic (accessed March 15, 2013).
Martin, Bill. "The Puzzle Behind Britain's Lamentable Statistics." Financial Times [London] 23 Feb. 2007: n. pag. Print.
Office for National Statistics. 'Blue Book Tables - UK Gross Domestic Product and National Income.' http://www.ons.gov.uk/ons/datasets-and-tables/data-selector.html?cdid=YBHA&dataset=bb&table- id=1.2 and http://www.ons.gov.uk/ons/datasets-and-tables/data-selector.html?cdid=ABMI&dataset=bb&table-id=1.2 (accessed March 1, 2013).
England. Office for National Statistics. Her Majesty's Stationery Office.Economic Trends Annual Supplement No. 22, 1996/97 Edition. Production Coordinator: Phil Lewin. London: n.p., August 1996.
England. Office for National Statistics.The Stationery Office.Economic Trends Annual Supplement No. 23, 1997 Edition.Production Coordinator: Phil Lewin. London:n.p., 1997.
England. Office for National Statistics.The Stationery Office.Economic Trends Annual Supplement No. 24, 1998 Edition. Edited by UzairRizki. Production Team: Paul Dickman, Phil Lewin and Chris Watts. London: n.p., 1999.
England. Office for National Statistics.The Stationery Office.Economic Trends Annual Supplement No. 25, 1999 Edition. Edited by Paul Dickman. Production Coordinator: Phil Lewin. London:n.p., 1999.
England. Office for National Statistics.The Stationery Office.Economic Trends Annual Supplement No. 26, 2000 Edition. Edited by Paul Dickman. London: n.p., 2000.
England. Office for National Statistics.The Stationery Office.Economic Trends Annual Supplement No. 27, 2001 Edition. Edited by Paul Dickman. London: n.p., 2001.
England. Office for National Statistics.The Stationery Office.Economic Trends Annual Supplement No. 28, 2002 Edition. Edited by Paul Dickman. London: n.p., 2002.
England. Office for National Statistics.The Stationery Office.Economic Trends Annual Supplement No. 29, 2003 Edition. Edited by Paul Dickman. London: n.p., 2004. http://www.ons.gov.uk/ons/rel/elmr/economic-trends--discontinued-/2003-edition/economic-trends-annual-supplement.pdf (accessed February 15, 2013).
England. Office for National Statistics.The Stationery Office.Economic Trends Annual Supplement No. 30, 2004 Edition. Edited by Paul Dickman. London: n.p., 2004. http://www.ons.gov.uk/ons/rel/elmr/economic-trends--discontinued-/2004-edition/economic-trends-annual-supplement.pdf (accessed February 15, 2013).
England. Office for National Statistics.The Stationery Office.Economic Trends Annual Supplement No. 31, 2005 Edition. Edited by Paul Dickman. n.p.: Palgrave Macmillan, 2005. http://www.ons.gov.uk/ons/rel/elmr/economic-trends'discontinued-/2005-edition/economic-trends-annual-supplement.pdf (accessed February 11, 2013).
England. Office for National Statistics.The Stationery Office.Economic Trends Annual Supplement No. 32, 2006 Edition. Edited by David Harper. n.p.: Palgrave Macmillan, 2006.
England. Office for National Statistics.The Stationery Office.'Labour Market Statistics - Integrated FR - Unemployment By Age &Duration' http://www.ons.gov.uk/ons/datasets-and-tables/data-selector.html?cdid=MGSC&dataset=lms&table-id=9 (accessed March 1, 2013).
England. Office for National Statistics.The Stationery Office.United Kingdom National Accounts: The Blue Book, 2007 Edition. Edited by John Dye and James Sosimi. Basingstoke, England: Palgrave Macmillan, 2007. http://www.ons.gov.uk/ons/rel/naa1-rd/united-kingdom-national-accounts/2007-edition/united-kingdom-national-accounts---the-blue-book.pdf (accessed February 15, 2013).
England. Office for National Statistics.United Kingdom National Accounts: The Blue Book, 2009 Edition.Edited by John Dye and James Sosimi. Basingstoke, England: Palgrave Macmillan, 2009. http://www.ons.gov.uk/ons/rel/naa1-rd/united-kingdom-national-accounts/2009-edition/united-kingdom-national-accounts---the-blue-book.pdf (accessed February 15, 2013).
England. Office for National Statistics.United Kingdom National Accounts: The Blue Book, 2010 Edition.Edited by John Dye and James Sosimi. Basingstoke, England: Palgrave Macmillan, 2010. http://www.ons.gov.uk/ons/rel/naa1-rd/united-kingdom-national-accounts/2010-edition/united-kingdom-national-accounts---the-blue-book.pdf (accessed February 15, 2013).
"Rosy Prospects, Forgotten Dangers." The Economist [New York City] 15 Apr. 2000: 15. Print. http://find.galegroup.com.proxy.cc.uic.edu/econ/dispBasicSearch.do?prodId=ECON&userGroupName=uic (accessed March 25, 2013).
Webster, Norman. "They're Off: Looks Like It'll Be a Rough Campaign." The Globe and Mail [Toronto] 30 Mar. 1979: n. pag. Print. http://find.galegroup.com.proxy.cc.uic.edu/econ/dispBasicSearch.do?prodId=ECON&userGroupName=uic (accessed March 15, 2013).
*The data collection and programing of the computations in this paper were done by JulienLeider.
Back to text
1
One could expect that each year a new version of the GDP is presented, there would be a publication explaining why there has been a change. I have not taken the time to look at all the ONS publications for previous years, but can say that for 2012, they have not been clear enough to understand the big changes that took place between the 2011 and 2012 tables.
Back to text
2 Many of these are intermediate aggregates and computed values in the 2012 base year prices.
Back to text
3 If the ONS is using new data from the research of economic historians, as far as I can tell, they have not reported it.
Back to text
4 It remained the same at $22,853 million from 1989 to 1997, but has changed three times since then and for the 2006 to 2012 reports is stayed at $23,050 million.
Back to text
5 See: 'New values for the UK GDP, are they better?' http://www.measuringworth.com/datasets/ukgdp/RewriteUK.php
Back to text
Please let us know if and how this discussion has assisted you in using our calculators.